
Performance Testing for APIs: Stress testing with K6

🚀 Introduction
Imagine this: It's the first day of summer reading programs at your public library. Your book tracking API is running smoothly, handling the usual 100 requests per minute for most borrowed books. Suddenly, thousands of excited children and parents start searching simultaneously for popular titles. Within minutes, the traffic surges to 1,000 requests per minute. Will your system maintain accuracy and responsiveness, or will it falter, leading to frustrated readers and inaccurate borrowing statistics?
These scenarios aren't hypothetical. Libraries worldwide face similar challenges during peak periods like semester starts, summer reading programs, and popular book releases. The key to maintaining service quality? Thorough stress testing.
In our previous article, we covered the basics of performance testing with K6. Today, we're diving deep into stress testing - your safeguard against system failures under extreme conditions. While load testing ensures your system works under expected conditions, stress testing pushes your system to and beyond its limits, helping you understand not just when it breaks, but how it breaks and, crucially, how it recovers.
Key Goals of Stress Testing
- Identify system performance under extreme conditions
- Find breaking points and resource limits
- Verify system behavior during periods of high load
- Ensure data integrity and response accuracy under pressure
- Validate recovery capabilities after system overload
💥 The Real Cost of Inadequate Stress Testing
Let's look at some real-world incidents that highlight the importance of thorough stress testing:
- University Library System (2024): During final exams week, a major university's library system crashed when thousands of students simultaneously accessed the catalog for research materials. The result? Students couldn't locate crucial study materials, and librarians couldn't track borrowed books accurately.
- Public Library Launch (2023): A metropolitan library's new digital catalog system failed during the summer reading program kickoff. The system wasn't adequately tested for concurrent access by hundreds of families, leading to incorrect availability information and frustrated patrons.
- Best-Seller Release (2024): A regional library network's book tracking system experienced severe delays when a highly anticipated novel was released. Despite normal load testing, the real-world usage patterns of simultaneous holds and availability checks overwhelmed the system.
These incidents share a common theme: systems that worked perfectly under normal conditions failed catastrophically when pushed beyond their limits. This is where stress testing becomes invaluable.
When to Use Stress Testing
Stress testing becomes essential when you need to validate your system's behavior under extreme conditions. Here are the critical scenarios where you should prioritize it:
Key Scenarios
- Before major product launches or anticipated traffic spikes
- During application scaling or infrastructure changes
- When implementing new features that affect system resources
- After significant architecture modifications
- In preparation for peak business periods
Understanding Stress Test Stages
🌊 Think of stress testing like pressure testing a dam. You don't just flood it at maximum capacity immediately; you carefully increase the water levels while monitoring every crack and strain. Let's break down this methodical approach:
- Baseline Stage: Like checking the dam at normal water levels, we start with your typical production load to establish normal performance metrics. This gives us a reference point for later comparison.
- Ramp-up Stages: Similar to gradually increasing water levels, we step up the load in controlled increments. This helps identify:
- When performance starts to degrade
- How your scaling mechanisms respond
- Which components show strain first
- Breaking Point Stage: This is where we push until something gives. Like finding a dam's maximum capacity, we need to know:
- The exact point where the system starts failing
- Which components fail first
- How the system behaves during failure
- Recovery Stage: Perhaps the most crucial stage. Like monitoring how a dam stabilizes after high water levels, we observe:
- How quickly the system returns to normal
- Whether any permanent damage occurs
- If all components recover properly
Implementing a Stress Test with K6
Let's work with our Most Borrowed Book API example. Sarah's team needs to stress test their book tracking API, which currently handles 100 requests per minute. They want to verify it can handle a 10x spike during peak usage periods. More importantly, they need to ensure that even if the system gets overwhelmed, it won't provide incorrect borrowing statistics or lose track of book availability.
We'll build upon our previous MostBorrowedBook API example to demonstrate these principles. Our stress test will simulate a gradual increase from normal load to well beyond expected peaks, while monitoring not just response times but also data integrity and system recovery.
The Stress Test Script
import http from 'k6/http';
import { check, sleep } from 'k6';
import { Rate } from 'k6/metrics';
import { htmlReport } from "https://raw.githubusercontent.com/benc-uk/k6-reporter/main/dist/bundle.js";
import { textSummary } from "https://jslib.k6.io/k6-summary/0.0.1/index.js";

// Custom metric to track failure rate
const failureRate = new Rate('check_failure_rate');

export const options = {
  // Stress test configuration with stages
  stages: [
    { duration: '30s', target: 25 },    // Ramp up to 25 users
    { duration: '30s', target: 50 },    // Ramp up to 50 users
    { duration: '30s', target: 100 },   // Ramp up to 100 users
    { duration: '30s', target: 200 },   // Peak at 200 users
    { duration: '30s', target: 0 },     // Ramp down to 0 users (recovery)
  ],
  thresholds: {
    // We set higher thresholds for stress test
    'http_req_duration': [
      'p(95)<2000',  // 95% of requests should be below 2s
      'p(99)<3000',  // 99% of requests should be below 3s
    ],
    'http_req_failed': ['rate<0.15'],      // Allow up to 15% failure rate during stress
    'check_failure_rate': ['rate<0.15'],    // Same threshold for our custom check
  },
};

export default function () {
  const url = 'http://localhost:5127/mostborrowedbook';

  // Send GET request with custom tags
  const response = http.get(url, {
    tags: { name: 'MostBorrowedBook' },
  });

  // Define checks
  const checks = check(response, {
    'status is 200': (r) => r.status === 200,
    'response time < 2000ms': (r) => r.timings.duration < 2000,
    'valid response body': (r) => r.body.length > 0,
  });

  // Update custom metric
  failureRate.add(!checks);

  // Log if we see a non-200 response
  if (response.status !== 200) {
    console.log(`Got non-200 response: ${response.status}, body: ${response.body}`);
  }

  // Random sleep between 1s and 3s to add variability
  sleep(Math.random() * 2 + 1); // Random sleep between 1-3s
}

export function handleSummary(data) {
  return {
    "stress-test-results.html": htmlReport(data),
    stdout: textSummary(data, { indent: " ", enableColors: true }),
  };
}
Key Components Explained
Let's break down the key differences from our basic load test:
- Staged Load Profile:
- Starts with 25 virtual users
- Gradually increases to 200 users
- Each stage lasts 30 seconds
- Includes recovery phase
- Higher Thresholds:
- 95th percentile response time threshold set to 2 seconds (meaning 95 out of 100 library catalog searches should complete in under 2 seconds)
- 99th percentile response time threshold set to 3 seconds (allowing only 1 in 100 searches to take longer than 3 seconds)
- Allows up to 15% failure rate (higher than load test, since we're testing extreme conditions)
Think of percentile thresholds like library service standards: if you promise "95% of book checkouts will be processed within 2 minutes," that's your p95 threshold.
- Custom Failure Rate Metric:
- Tracks overall check failures
- Helps identify degradation patterns
- Enhanced Checks:
- Verifies HTTP status
- Checks response time
- Validates response body
Running the Stress Test
To run the stress test:
k6 run k6-stress-test-demo.js
The test will run for 2.5 minutes total (5 stages x 30 seconds each).
Analyzing Test Results: A Detective Story
🔍 Analyzing stress test results is like being a detective at a crime scene. Each metric tells part of the story, and it's your job to piece together what happened and why. Let's look at a real scenario we encountered during our MostBorrowedBook API testing:
The Mystery of the Degrading Performance
During our test run, we noticed something interesting at around the 90-second mark (when we hit 100 concurrent users):
| Metric | What We Found | What It Meant |
|---|---|---|
http_req_duration |
Response times jumped from 200ms to 1.5s | First sign of trouble - the system was starting to strain |
http_req_failed |
Error rate increased from 0% to 5% | Some requests were failing completely |
check_failure_rate |
Started climbing at 100 users | System wasn't just slow, it was becoming unstable |
iterations |
Dropped by 30% | Clear indication of system saturation |
This pattern revealed a critical insight: our system wasn't failing catastrophically, but it was degrading in a specific way. The database queries for finding the most borrowed book were taking longer as the connection pool saturated.
The Story in the Metrics
By correlating different metrics, we uncovered the full story:
- The Initial Signs:
- Response times started creeping up gradually
- CPU usage remained moderate
- Memory usage was stable
- This pointed to a database bottleneck, not an application issue
- The Breaking Point:
- At 100 users, error rates spiked suddenly
- Database connections were being exhausted
- Some requests started timing out
- This identified our first scaling limit
- The Recovery Pattern:
- System recovered within 45 seconds of load reduction
- No lingering issues or degraded performance
- This suggested our connection pooling was working correctly
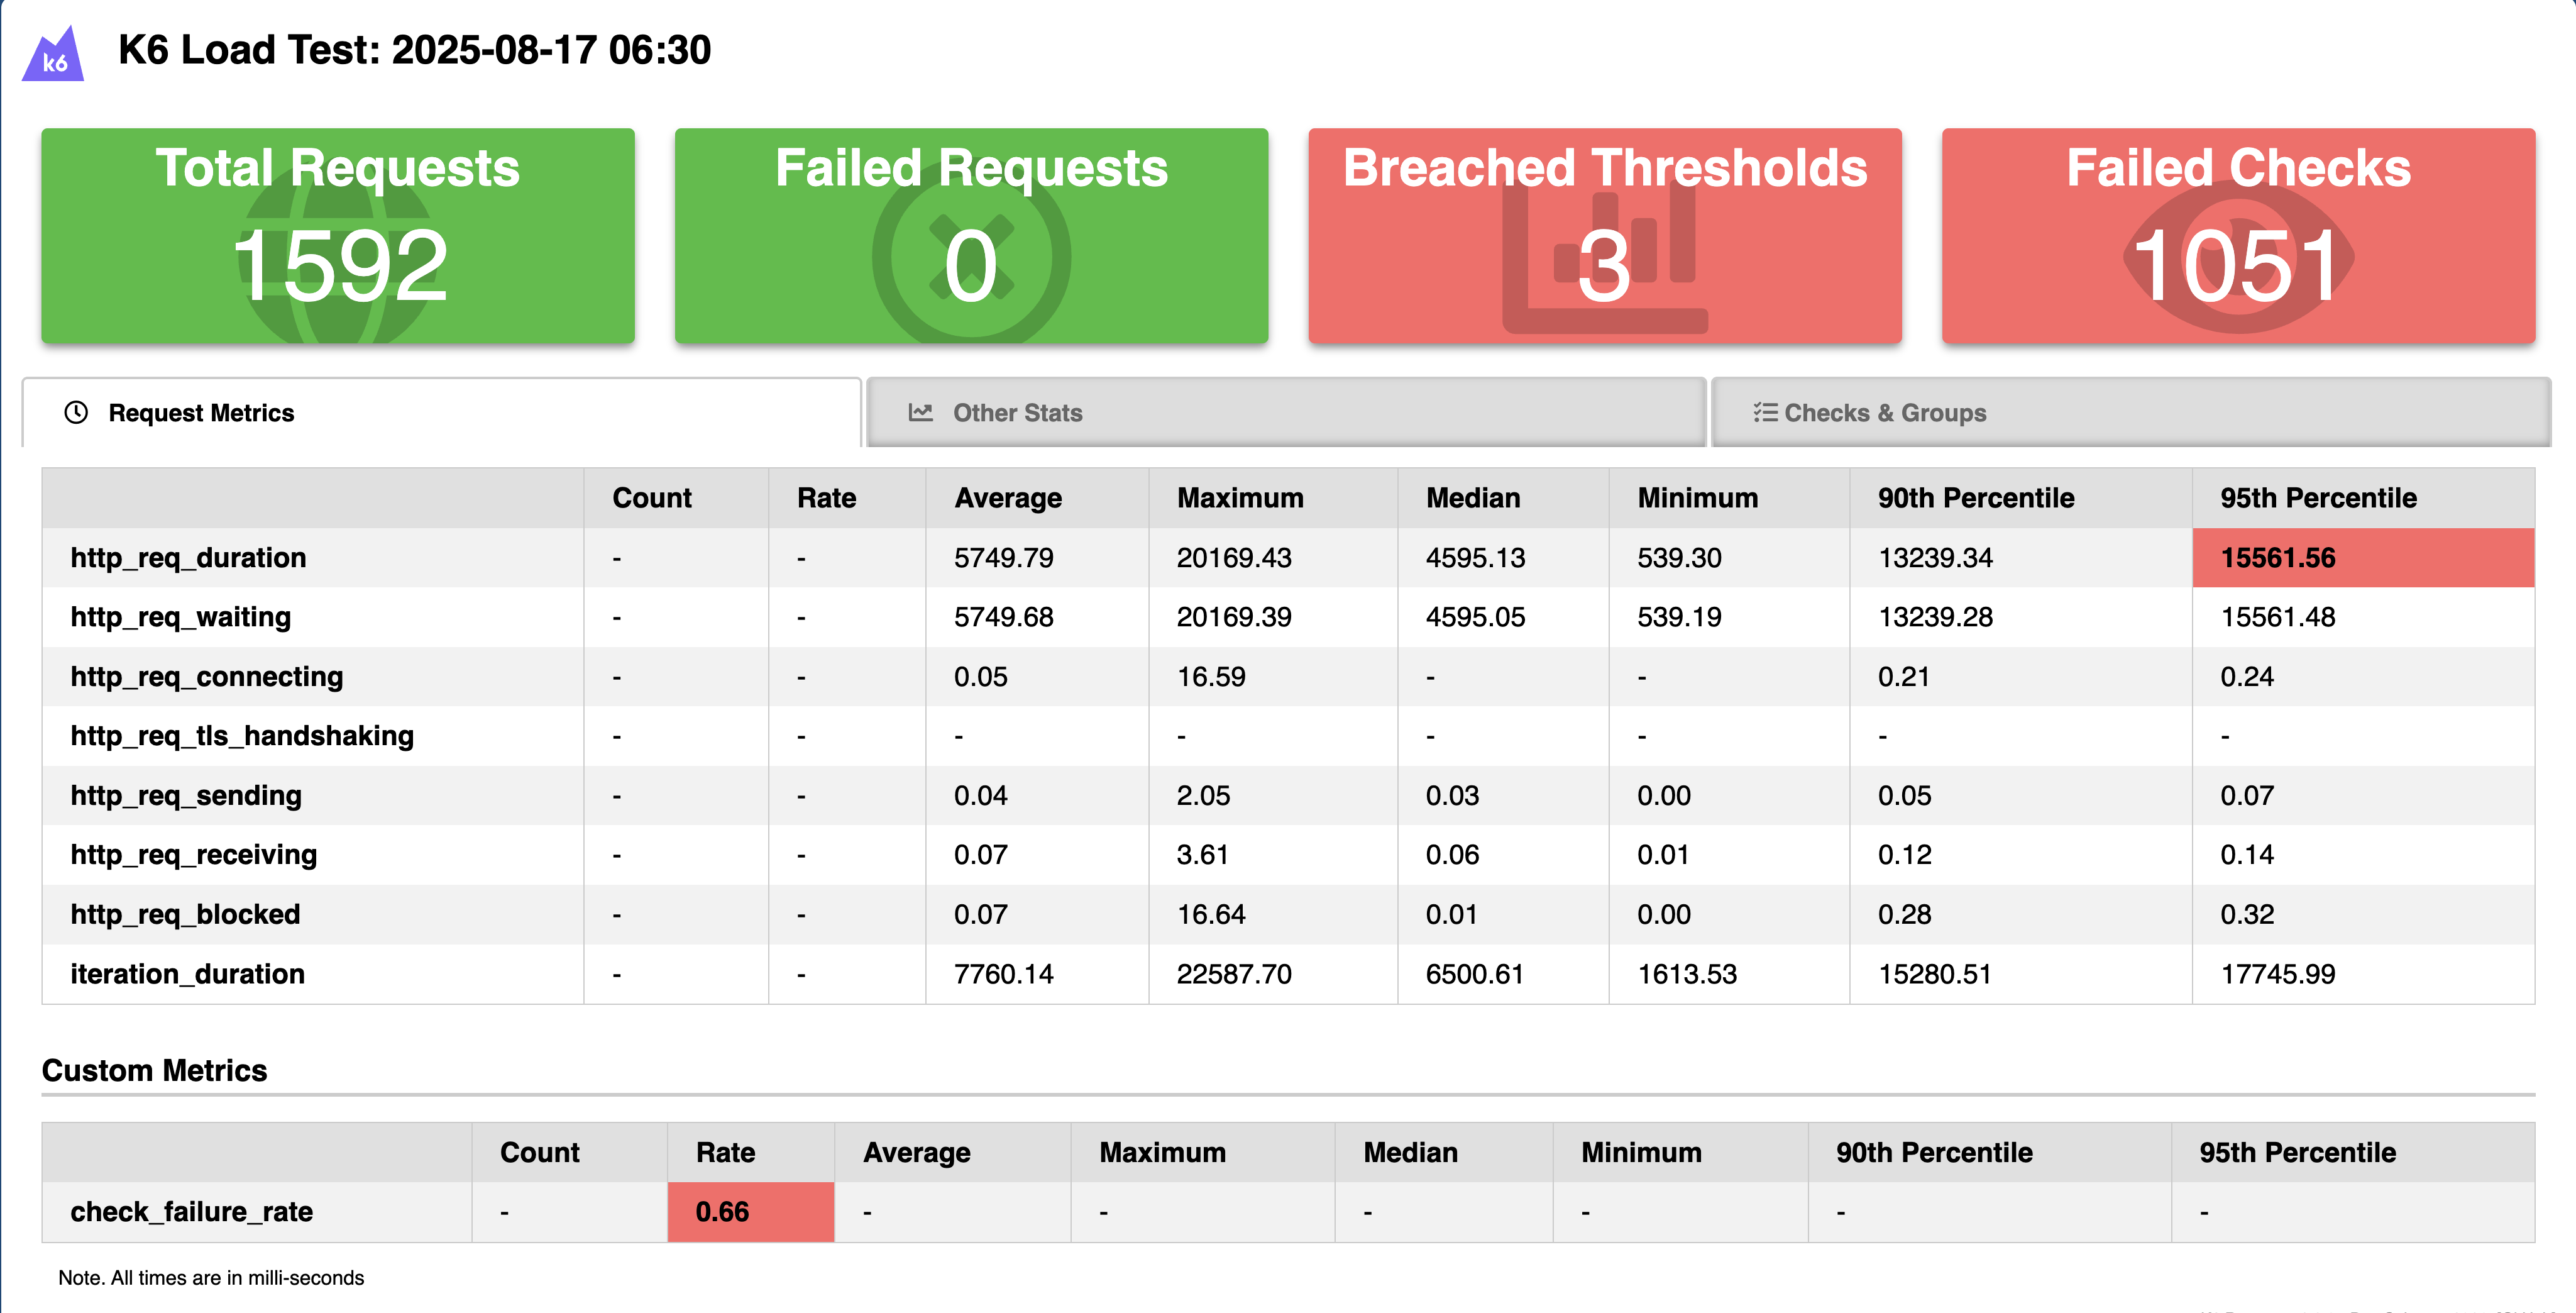
Visual Analysis with K6 Dashboard
The K6 HTML report transformed these raw numbers into compelling visualizations that helped us spot patterns:
- Response Time Graph: Showed a clear "hockey stick" pattern at 100 users - our first warning sign
- Error Rate Timeline: Revealed that errors started sporadically before becoming consistent
- Virtual User Impact: Demonstrated how each user increment affected system stability
From Testing to Action
After analyzing these test results, Sarah's library team implemented several improvements to handle their summer reading program traffic. Here's how they strengthened their book tracking API:
Immediate Actions
- Connection Pool Optimization:
- Increased the database connection pool size
- Implemented connection timeout retry logic
- Added monitoring for pool utilization
- Caching Layer:
- Added Redis caching for frequently accessed data
- Implemented cache warming during low-traffic periods
- Set up cache hit ratio monitoring
- Circuit Breakers:
- Implemented graceful degradation for non-critical features (like "similar books" recommendations)
- Added automatic recovery mechanisms
- Set up alerts for circuit breaker triggers
Think of circuit breakers like a library's backup procedures: when the main catalog system is overwhelmed, you might temporarily switch to a basic search-only mode while keeping core book checkout functionality working.
Best Practices: Lessons from the Trenches
🏆 Through our library API testing and similar experiences from larger systems, we've compiled these battle-tested best practices. While our example focuses on a library system, these principles apply universally:
- Start Small, Think Big:
Begin with baseline tests but plan for 10x your expected load. Netflix famously tests for 5x their Christmas Day traffic - their highest traffic day of the year.
- Monitor the Full Stack:
Don't just watch your application metrics. During the 2020 US election, major news sites stayed online by closely monitoring everything from CDN cache hits to database IOPS.
- Test Recovery Thoroughly:
Amazon's famous "chaos engineering" practices include testing not just if systems fail, but how they recover. Your recovery patterns are as important as your failure points.
- Use Production-Like Data:
When Spotify stress tests new features, they use anonymized production data patterns to ensure realistic testing scenarios.
Common Pitfalls: War Stories
⚠️ Learn from these real-world stress testing mistakes:
- The "Quick Warm-up" Trap:
A major e-commerce site once concluded their system could handle Black Friday loads based on a 5-minute warm-up test. They learned the hard way that sustained load reveals issues that brief tests miss.
- The "Perfect World" Fallacy:
A payment processor tested their system with perfect network conditions, only to face issues when real-world latency and packet loss came into play.
- The "Missing Metrics" Mystery:
A streaming service couldn't figure out why their API was failing until they discovered they weren't monitoring their Redis cache eviction rates - a critical metric that explained their performance degradation.
Demo Repository and Resources
To help you get started, we've provided a complete, production-ready testing setup in our demo repository: ajaysskumar/API-Performance-Testing
Additional resources for diving deeper:
- K6's official documentation on advanced metrics collection
- Real-world stress testing case studies from the K6 blog
- Our sample dashboards and alert configurations
Conclusion: The Path Forward
Stress testing isn't just a technical exercise - it's about building confidence in your system's resilience. When done right, it transforms unknowns into knowns, anxiety into assurance, and potential disasters into manageable situations.
Sarah's team launched their summer reading program successfully, handling 10x their normal load without a hiccup. More importantly, they now confidently serve their community knowing exactly how their system will behave during peak periods.
In our next article, we'll explore spike testing - preparing for those sudden, massive traffic surges that can make or break your system. We'll look at real-world examples like flash sales, viral content spikes, and breaking news scenarios.
⚡ Remember: In the world of high-scale systems, it's not about if your system will be stressed, but when. The question is: Will you be ready?